SL4 - Application Insights For Structured Logging
Let's explore how Application Insights can be used to analyse structured logs
Welcome
I decided to share my knowledge about Structured Logging using 4 Post series in the hope that someone in community can benefits from it. I tried to make these post Beginner Friendly so if some experienced readers find it too basic/boring i apologies in advance.This is the third post in the series
All the posts from the series:
- All about structured logging - Introduction
- Getting Started with Serilog - Fundamentals
- Serilog Recipes - Templates, LogContext, Enriching Logs etc
- Application Insights for Structured Logging(This Post)
Code files for this series can be found at GitRepo
Agenda
These are topics that we will discuss during this post in context of structured logging.
Application Insights for Structured logs
- Why app insights.
- Configure serilog for app insights.
- Query Language using application insight analytics
- Useful Links.
Without any further delay lets get started with the first topic Why i use application insights
Why use Azure Monitor and Application Insights ?
I will try to refrain from sounding like that i am trying to sell Application Insights to you. First let’s make it clear this post is not about comparing application insights with other options out there. I will try to highlight some benefits that i noticed in my use case. I am not an expert on Azure Monitor and Application Insights but here are few benefits of that i noticed while using application insights.
- If your application are written using
.NETand.NET Corethen integrating with ‘Application Insights SDK’ can capture lot of useful telemetry data/Info without even writing single line of code for custom logging. - If you are using Azure cloud as your cloud provider. Application insights are naturally a go to option for
Monitoringas it can be configured for any of your Azure Resources very easily. - It is full fledge monitoring solution and Logging structured events is just a part of it as it is one of the components of
Azure Monitorsuite. - It comes with a suite of powerful analysis tools and query language that you can for analysis of data collected with
application insights - You can use application insights to create alerts and even extract monthly performance reports.
- Provided as SAAS
- Fairly easy to integrate with
Serilog
and many more..
You can check on Azure Documentation Website to learn more about the application insights if you are interested in learning more.
Configure Serilog for App insights
Now enough of theory let’s see how we can use Application Insights and Serilog together in our application. We can break the configuration process into 2 steps.
- Create Azure Application Insights Resource.
- Updating the Application to support Application insights.
Without any further delay lets start with each of them
1. Creating Application insights resource
To create and use any Azure Services you must have an active azure subscription. But good news is Azure giving away 150$ free credit to try out their services but the credit will expire after 30 days and this credit will be more than enough for our exploration of application insight features. Sorry if this whole process was a bit hassle for you i could not find better way to get this done.
Step 1: Create free azure account using this Link
Step 2: Create Application Insight resource under your account using steps 1 to 3 from here.
Once you have the Application Insights resource created click on it to view details and the overview section should look something like.
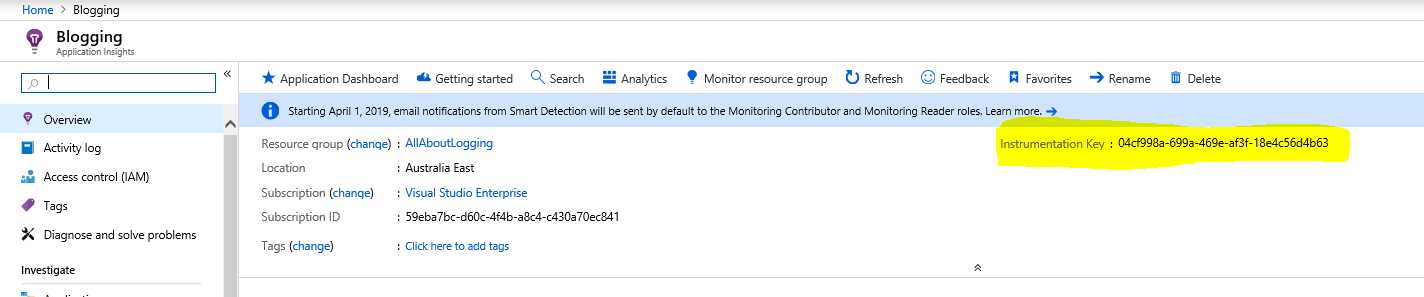
Instrumentation Key is something that you should be interested in.
2. Updating application to support application insights.
I assume you already have Serilog reference in your application so lets start by adding reference to a nuget package for using Application Insights as your Sink for Serilog.
Install-Package Serilog.Sinks.ApplicationInsights -Version 3.0.2Next step will be configuring the Serilog to write to application insights. This can be done at the Configuration time to configure it globally.
You can use something like below
var loggerConfiguration = new LoggerConfiguration()
                .ReadFrom.Configuration(configuration)
                .Enrich.FromLogContext()
                //Write logs to application insights
                .WriteTo.ApplicationInsights(aiKey)
As we can see we added WriteTo.ApplicationInsights to configure ApplicationInsights as you Serilog Sink. But there is a parameter passed aiKey and this parameter is Required.
This parameter actually helps you define which Application Insights resource it should send the Logging data. So it’s a way to connect your Serilog to a Application Insight resource in the cloud. How you obtain the AIKey it’s located in the overview section of the application insight record. (Highlighted in Yellow).
You can pass some additional parameters to the WriteTo.ApplicationInsights one of them is custom TraceTelemetryConverter. So your configuration can be something like.
var loggerConfiguration = new LoggerConfiguration()
                .ReadFrom.Configuration(configuration)
                .Enrich.FromLogContext()
                //Write logs to application insights
                //And also use a custom converter
                .WriteTo.ApplicationInsights(aiKey, new ConvertLogEventsToCustomTraceTelemetry());
We will now look at the code for TraceTelemetryConverter. But first let’s look at Why we need it?
Answer to this question is Customization.
Using custom TraceTelemetryConverter you can customize whether to send the LogEvents at all, if so which type(s) of Telemetry to send and also what to send and customize the message before it is sent to Application Insights. Here is some sample TraceTelemetryConverter that modify the Event before it is sent to Application Insights for ingestion.
//Program.cs

public class ConvertLogEventsToCustomTraceTelemetry : TraceTelemetryConverter
    {
        public override IEnumerable<ITelemetry> Convert(LogEvent logEvent, IFormatProvider formatProvider)
        {
            // first create a default TraceTelemetry using the sink's default logic
            // .. but without the log level, and (rendered) message (template) included in the Properties
            foreach (ITelemetry telemetry in base.Convert(logEvent, formatProvider))
            {
                // then go ahead and post-process the telemetry's context to contain the user id as desired
                if (logEvent.Properties.ContainsKey("UserId"))
                {
                    telemetry.Context.User.Id = logEvent.Properties["UserId"].ToString();
                }

                // post-process the telemetry's context to contain the operation id
                if (logEvent.Properties.ContainsKey("operation_Id"))
                {
                    telemetry.Context.Operation.Id = logEvent.Properties["operation_Id"].ToString();
                }

                // post-process the telemetry's context to contain the operation parent id
                if (logEvent.Properties.ContainsKey("operation_parentId"))
                {
                    telemetry.Context.Operation.ParentId = logEvent.Properties["operation_parentId"].ToString();
                }

                // typecast to ISupportProperties so you can manipulate the properties as desired
                ISupportProperties propTelematry = (ISupportProperties) telemetry;

                // find redundent properties
                var removeProps = new[] {"UserId", "operation_parentId", "operation_Id"};
                removeProps = removeProps.Where(prop => propTelematry.Properties.ContainsKey(prop)).ToArray();

                foreach (var prop in removeProps)
                {
                    // remove redundent properties
                    propTelematry.Properties.Remove(prop);
                }

                yield return telemetry;
            }
        }
    }
Here in this example we enriching the Telemetry data by extracting the properties or parameters from LogEvent sent by Serilog it is possible because the Data sent by the Serilog is in the form of Structured Events. If the data will be Human Friendly strings extracting these parameters will be lot more challenging.
Query Language using application insight analytics
Now we gonna discuss about the one of really powerful feature of the Azure Monitor that allow you to Query the data collected using the Serilog and Application Insights.
In order to show the query language features I created a new controller in the code files LoggerController that will just create log entries with random UserName and Duration for processing. Just to create a data set for analysis.
        [HttpGet]
        [Route("generate")]
        public ActionResult GenerateLogEntry()
        {
            var random = new Random();
            //Select some random user
            var index = random.Next(0, _users.Count);
            //Add some random duration to process request
            var duration = random.Next(50, 2000);
            _logger.LogInformation("Processed Request for {User} in {Duration}milliseconds", _users[index], duration);
            return Ok("Logged Successfully");

        }
Then i called this controller action about 500 time using Postman runner to generate some analytics data to run queries.
Now we will think of some imaginary scenario (Simple ones) for analysis of the logging data.
Scenario 1:
You want to get the requests that were sent by UserName “James” in Last 24 hours because you think his account is misused.
traces
| where timestamp > ago(24h)
| where customDimensions.User=="James"
Scenario 2:
Use named Nathan called the office and complaining application was running really slow for him. You want the top Ten slowest api requests made by Nathan.
We can get the top 10 slowest request by user Nathan
traces
| where timestamp > ago(24h)
| where customDimensions.User=="Nathan"
| order by toint(customDimensions.Duration) desc
| take 10
| project customDimensions.User, customDimensions.Duration, timestamp
Scenario 3:
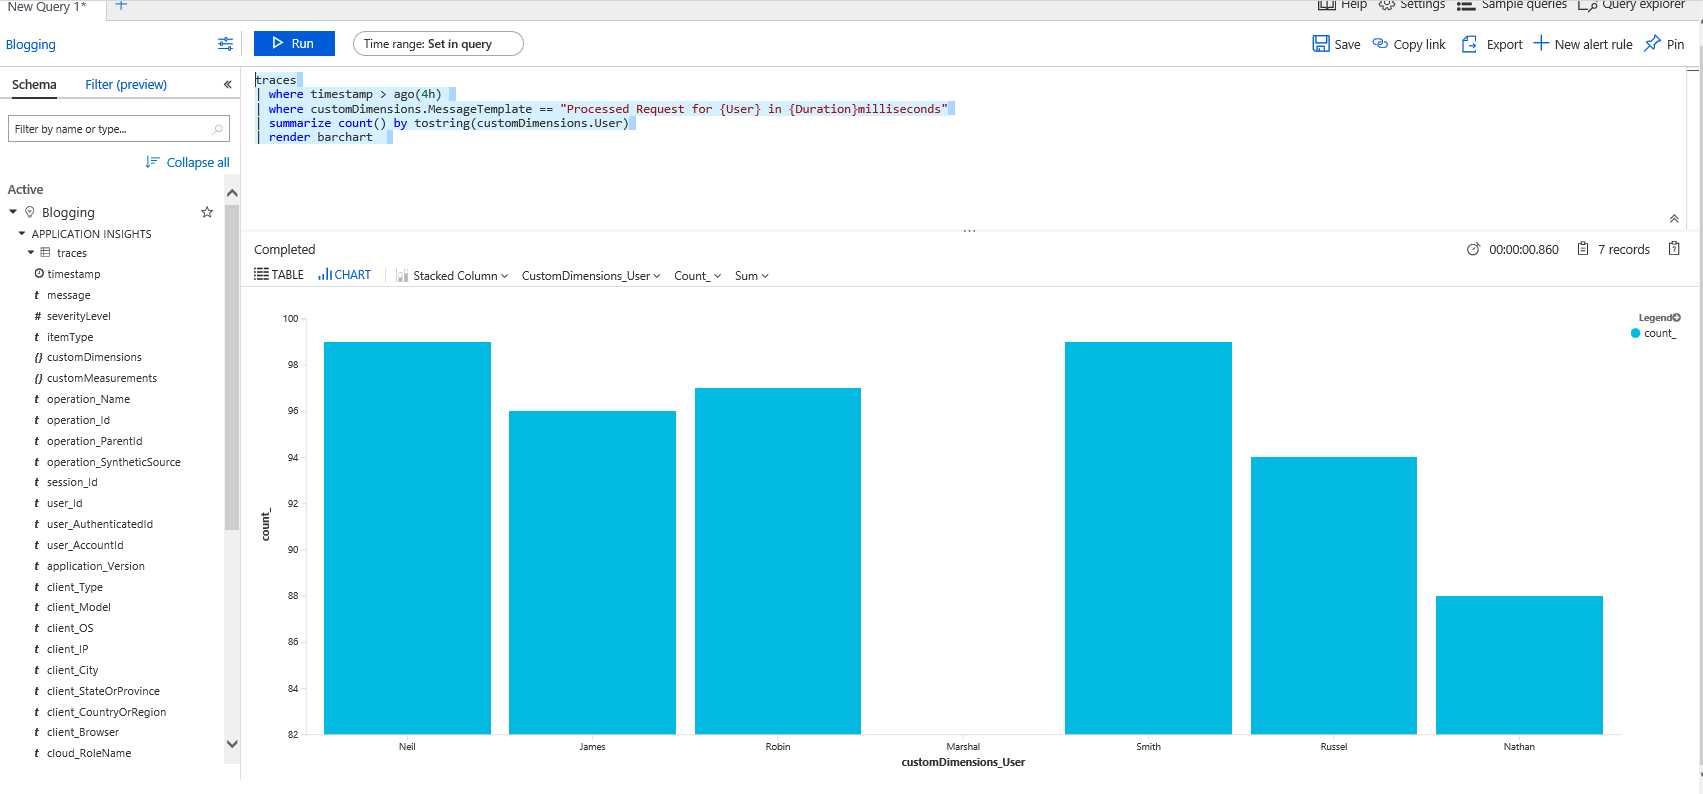
You want to find out how many request to your controller method may be each user in last 4 hours.
traces
| where timestamp > ago(4h)
| where customDimensions.MessageTemplate == "Processed Request for {User} in {Duration}milliseconds"
| summarize count() by tostring(customDimensions.User)
| render barchart
and this will query will produce something like
Scenario 4 Average response time for each User in last 4 hours
traces
| where timestamp > ago(4h)
| where customDimensions.MessageTemplate == "Processed Request for {User} in {Duration}milliseconds"
| summarize avg(toint(customDimensions.Duration)) by tostring(customDimensions.User)
| render timechart
This query will produce something like.
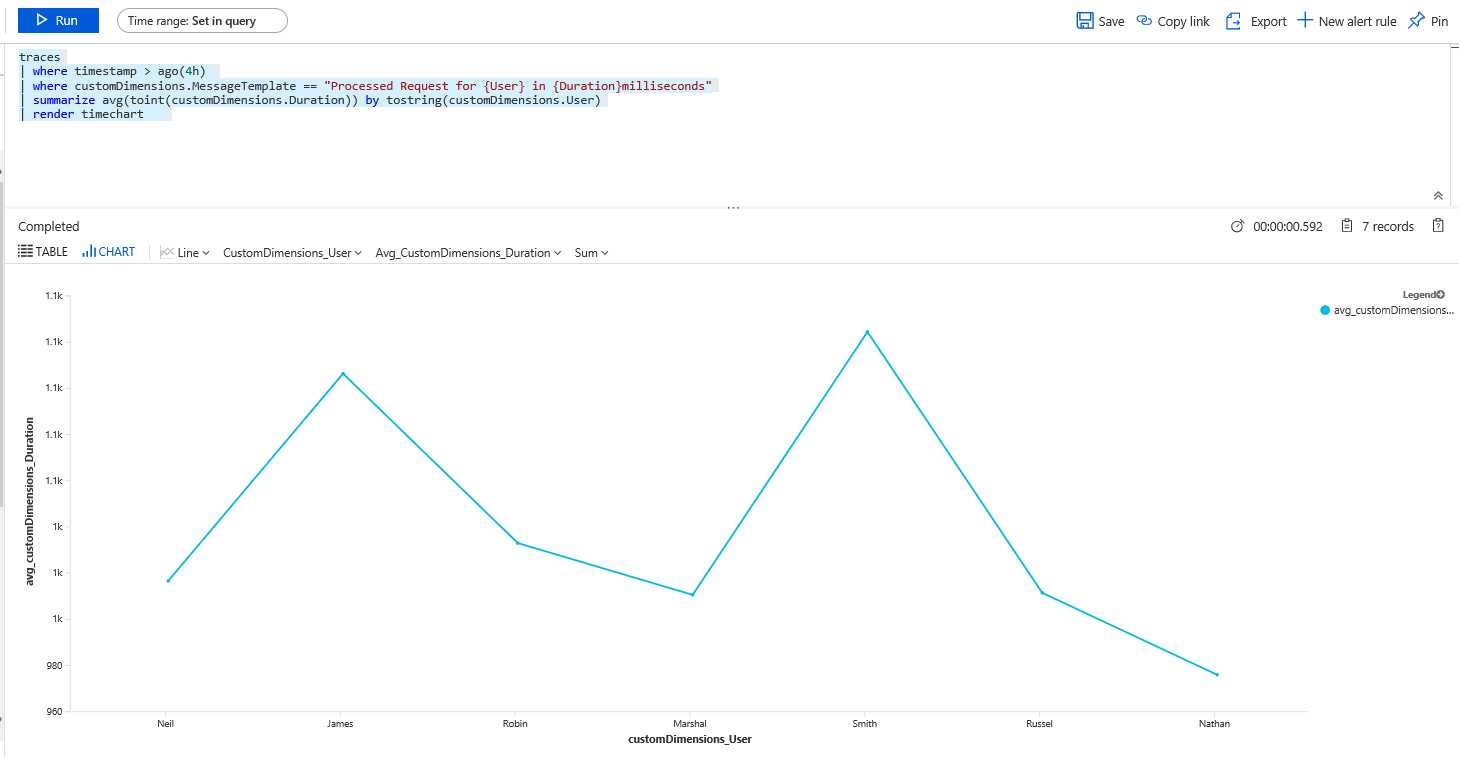
Amazing isn’t it how easy it is to visualize the result. You can create similar charts and Add them to your monitoring Dashboards with few click and these dashboard can be made public that can be displayed on big screens for live monitoring.
I understand there are better ways with applications insights to collect information for above scenario. You can filter the request to a particular Api Endpoint then sort them by the Duration to process or you can even further filter them by the UserId. But i will leave it to you to explore all the features of Azure Monitor or Application Insights. Purpose of this post was to demonstrate how you can Query Language to filter out the Structured Events logged using Serilog. I think this will help you get started with using Application Insights query language.
This was a very basic example and your everyday needs are way more complex but can assure you from my experience this query language was capable of catering to even one of most complex needs to the date.
Useful Links
I think Application Insights or Azure Monitor is a really powerful and feature rich platform. It is almost impossible to capture or share that knowledge using a blog series and moreover it is changing every day.
But i thought i should leave readers with few pointers about how they keep their knowledge upto date and learn more about application Insights if they are interested.
- Overview Azure Monitor - Bigger Picture
- Analytics Playground
- More about query language
- Creating Dashboard
- Creating Alters
Time to say goodbye (+Shameless Plug)
In this post we discussed how we can use application insights in collaboration with Serilog and we also looked at some amazing features of application insights. This was the last post of the series. I hope i will see you soon with some other blog post.
If you like my posts remember your words of appreciation goes long way in inspiring me to keep writing. If you do not want to miss my future posts follow me on Twitter